In this post our Vice President, Mike Iapalucci will give a quick overview of the fiber data currently available from the FCC, talk about how to access this data together with its use cases and limitations. Also included is a review of the data available from FiberLocator for the same locations and a comparison of the results.
FCC Broadband Data Collection
The FCC formally sunset the collection of broadband data coverage from carriers using FCC Form 477 effective December 16, 2022.1 The 477 data, as it came to be known, was replaced with a new collection system called the Broadband Data Collection system. The Form 477 data was based on internet service providers (ISPs) providing serviceability data for specific census blocks. Data included whether the service was residential, business, or both and the max up and download speeds available. The new system relies on the National Broadband Serviceable Location Fabric which is a list of all US residential and business locations and whether they have fixed broadband installed or can receive fixed broadband service from an ISP.2
This system is used to support the National Broadband Map which allows users to search by address for a broadband serviceable location (BSL) or by geocoordinate (latitude, longitude). Let’s look at the city of Evansville, IN located in the southwest corner of the state.
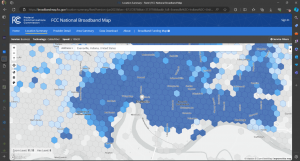
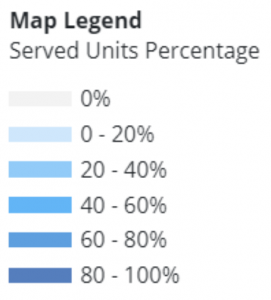
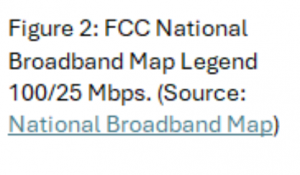
The first thing we notice is the map is overlaid with hexagons filled with shades of blue. These varying shades represent the percentage of serviced locations for businesses by either fiber or cable at an upload/download speed of greater than or equal to 100 Mbps download/25 Mbps upload. This is the standard for broadband recently adopted by the FCC.3 The legend below shows the percentage of business locations within the hexagon receiving or capable of receiving broadband service at these speeds based on its color.
I chose this location as it is in a medium sized county – Vanderburgh County with an estimated population of 179,810 as of 2023.4 Further in this comparison we will zoom out to include neighboring counties.
The FCC map bears out my assumption on number of carriers as there appears to be pretty good coverage at 80% to 100% for the city and nearby locations.
Uber H3 Hexagons
H3 is a grid system developed by Uber to optimize ride pricing and dispatch. The system is made up of varying size hexagons that are drawn across the surface of the earth. H3 hexagons come in 16 different sizes or resolutions (0 -15)5. One of the advantages of using hexagons is that they are a regular polygon that can be grouped together to cover larger areas than what is represented by a single hexagon and the distance is the same from the center of hexagons to any of its adjoining hexagons. This also makes it useful for estimating radius distances.6
Zooming in and out of the National Broadband Map will reveal hexagon resolutions between 5 and 9. Resolution 5 is shown at the national level with each hexagon representing approximately 250 square kilometers (km2) and resolution 5 is street level with an area of about 105 square meters (m2)7. You can find more information about H3 hexagons from Uber’s H3 site (H3 | H3 (h3geo.org).
Downloading BDC Data
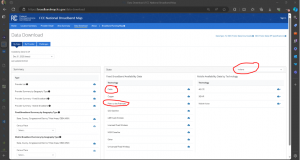
The same data that was available with the FCC 477 data is now available from the FCC website at Data Download | FCC National Broadband Map. The differences between the BDC data and FCC 477 data include the need to download data for each state individually as well as for the technology of interest. For our purposes we will download the Cable and Fiber to the Premises files for Indiana. Please note that the data is from December 31, 2023 (the most current), and has just been published in June of this year meaning there is a six month lag between data as-of date and the distribution date.
The data is provided in the form of a CSV file. The cable file has a total of 2,302,399 records representing Broadband Serviceable Locations (BSLs). The Fiber to the Premises file contains 1,899,190 BSLs. Combining these two files gives us a total of 4,201,589 BSLs. To focus on the southwest corner of Indiana where Evansville is located, we will filter the file to include Vanderburgh County along with three adjacent counties: Posey County, Warrick County, and Spencer County.
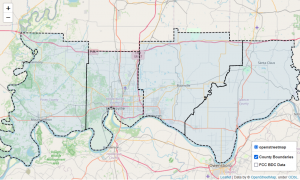
Since the data file includes the Census Block FIPS code, we can easily limit the data set to just these four counties using the first five digits: 18129, 18163, 18173, 18147 for Posey, Vanderburgh, Warrick, and Spencer counties respectively.
Here is a complete list of data fields contained in the BDC file:
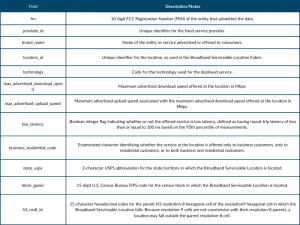
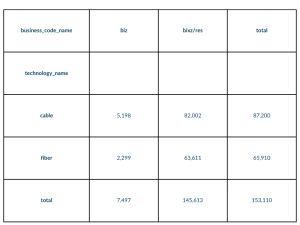
In addition to limiting the data to the four counties, we will also include only business locations. Of the three codes available in business_residential_code, we will exclude R (Residential) and keep B (Business) and X (Business/Residential).
This results in a total of 153,110 BSLs. This is further summarized in Table 2 below.
To see which providers are present and the number of BSLs they serve, we can summarize on brand_name. Table 3 provides these counts with providers ranked from largest to smallest number of BSLs.
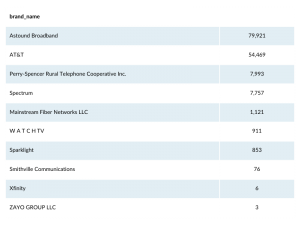
Here we can see that Astound and AT&T are far and away the largest providers followed by Perry Spencer Rural Telephone Cooperative, Spectrum and Mainstream Fiber Networks.
To map this data, we need to use the H3_res8_id values to determine the geographic location of the associated hexagon. I used Python and Uber’s open-source libraries to generate the feature data for each hexagon based on its ID. One word of caution is in the description provided by the FCC for the H3 values. While an H3 resolution of 8 is supplied, the actual BSLs are mapped to resolution 9 H3 hexagons. The H3 8 resolution hexagon is the parent of the H3 9 resolution child hexagon. While in most cases a location in a child hexagon will also be found in its parent hexagon, this is not always the case. As can be seen in this image from Uber, a parent hexagon does not contain the entirety of its child hexagons.
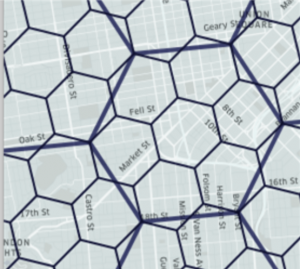
For more information on why this is the case, see the H3 documentation5.
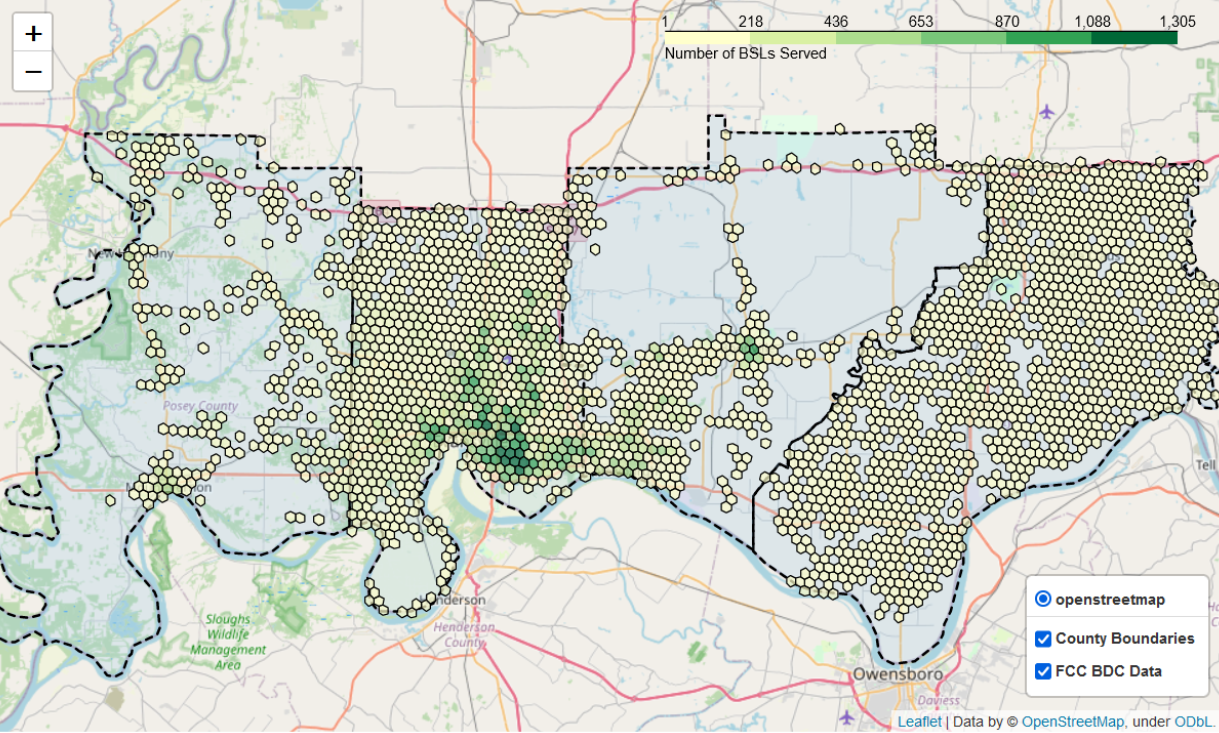
One of the interesting things you can do with hexagon data is use it to summarize data. This done by creating summary values for each hexagon and then displaying the data as a heat map. Let’s take a look at the four counties we are interested in using the H3 data to summarize the number of BLSs. I used Python to create the summary data.
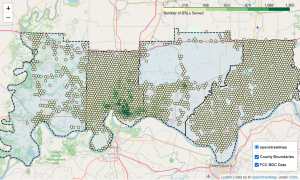
From this map we can see that the greatest concentration of locations is in and around Evansville. In addition to summarizing the number of BSLs in each hexagon, I have also summarized the carriers present, the technologies available (Cable or Fiber) and the type of client (Business, Business/Residential).
Adding FiberLocator Data
We have seen how to access the FCC BDC data and map it to get a sense of broadband coverage density and also identify the carriers providing service to business clients in a particular area of interest. Now let’s see what FiberLocator can add to the picture.
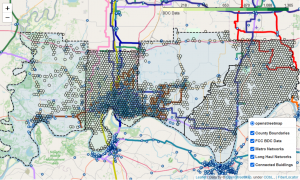
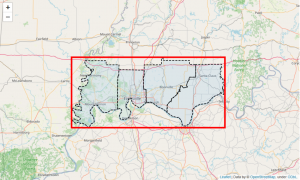
By adding the metro and long haul fiber networks together with connected buildings from FiberLocator, a picture begins to emerge. It is clear that Evansville is a hub of connectivity that stretches east and west to the other counties. But to see the entire picture, we need to identify the carriers that make up these layers.
The easiest way to do this is to draw a bounding box around the four counties and query the FiberLocator API for all layers that are contained in this bounding box.
Here is the list of FiberLocator layer names:
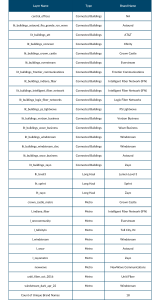
FiberLocator collects data directly from carriers and receives connected building point data along with fiber lines that include both metro and long haul networks. In some cases, there is duplicative coverage between the point data and fiber lines from individual carriers. Table 4 provides the complete list of fiber layers. Excluding the Central Office layer which does not have a single brand name (since it is the telco central office location managed by the regional LEC), there are 18 unique brands or carriers available in FiberLocator. Let’s compare this list with the brands available for the FCC BDC data.
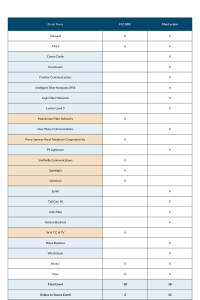
The comparison shows that there are 18 providers available in FiberLocator versus 10 from the FCC BDC data. In addition to indicating whether a specific brand is available in each data source, I have highlighted the BDC only providers in orange and the FiberLocator only providers in blue. The results show that for major providers such as AT&T, Astound, Xfinity, and Zayo, both sources show coverage. From the FCC BDC, there are 6 providers not covered by FiberLocator. With the exception of Spectrum, these providers are smaller, Indiana located providers focused on rural coverage.
From FiberLocator, there are 14 providers not covered by the FCC BDC data. These include major carriers such as Crown Castle, Lumen, Sprint, Verizon Business, and Windstream. The bottom line is that neither data source provides the complete picture, but FiberLocator is providing a greater number of carriers especially from major, national providers versus the FCC BDC data which includes more local, rural focused providers.
If you are interested in reproducing this analysis or applying the methods used to other locations, all of the code used to download and analyze the BDC data for Indiana is available for download via Python Jupyter Notebook. To access the code, please complete the form below, and one of our team members will email it to you. Please contact me at miapalucci@ccmi.com if you have any questions or comments.
References
1 Public Notice, Federal Communications Commission (2022). https://docs.fcc.gov/public/attachments/DA-22-1345A1_Rcd.pdf
2 National Broadband Serviceable Location Fabric Resource Center, CostQuest Accociates, Accessed June 21, 2024. https://www.costquest.com/broadband-serviceable-location-fabric/
3 FCC Increases Broadband Speed Benchmark, Federal Communications Commission (2024). https://docs.fcc.gov/public/attachments/DOC-401205A1.pdf
4 QuickFacts, Vanderburgh County, Indiana, United States Census Bureau, Accessed June 21, 2024. https://www.census.gov/quickfacts/fact/dashboard/vanderburghcountyindiana/PST045221
5 H3: Uber’s Hexagonal Hierarchical Spatial Index, Uber Blog (2018). https://www.uber.com/en-FI/blog/h3/
6 Tähtinen, Sara, Exploring Location Data Using a Hexagon Grid, Medium (2024) https://medium.com/towards-data-science/exploring-location-data-using-a-hexagon-grid-3509b68b04a2
7 Tables of Cell Statistics Across Resolutions, H3, Accessed June 21, 2024. https://h3geo.org/docs/core-library/restable#average-area-in-km2

